Real intelligence.
Smarter decisions.
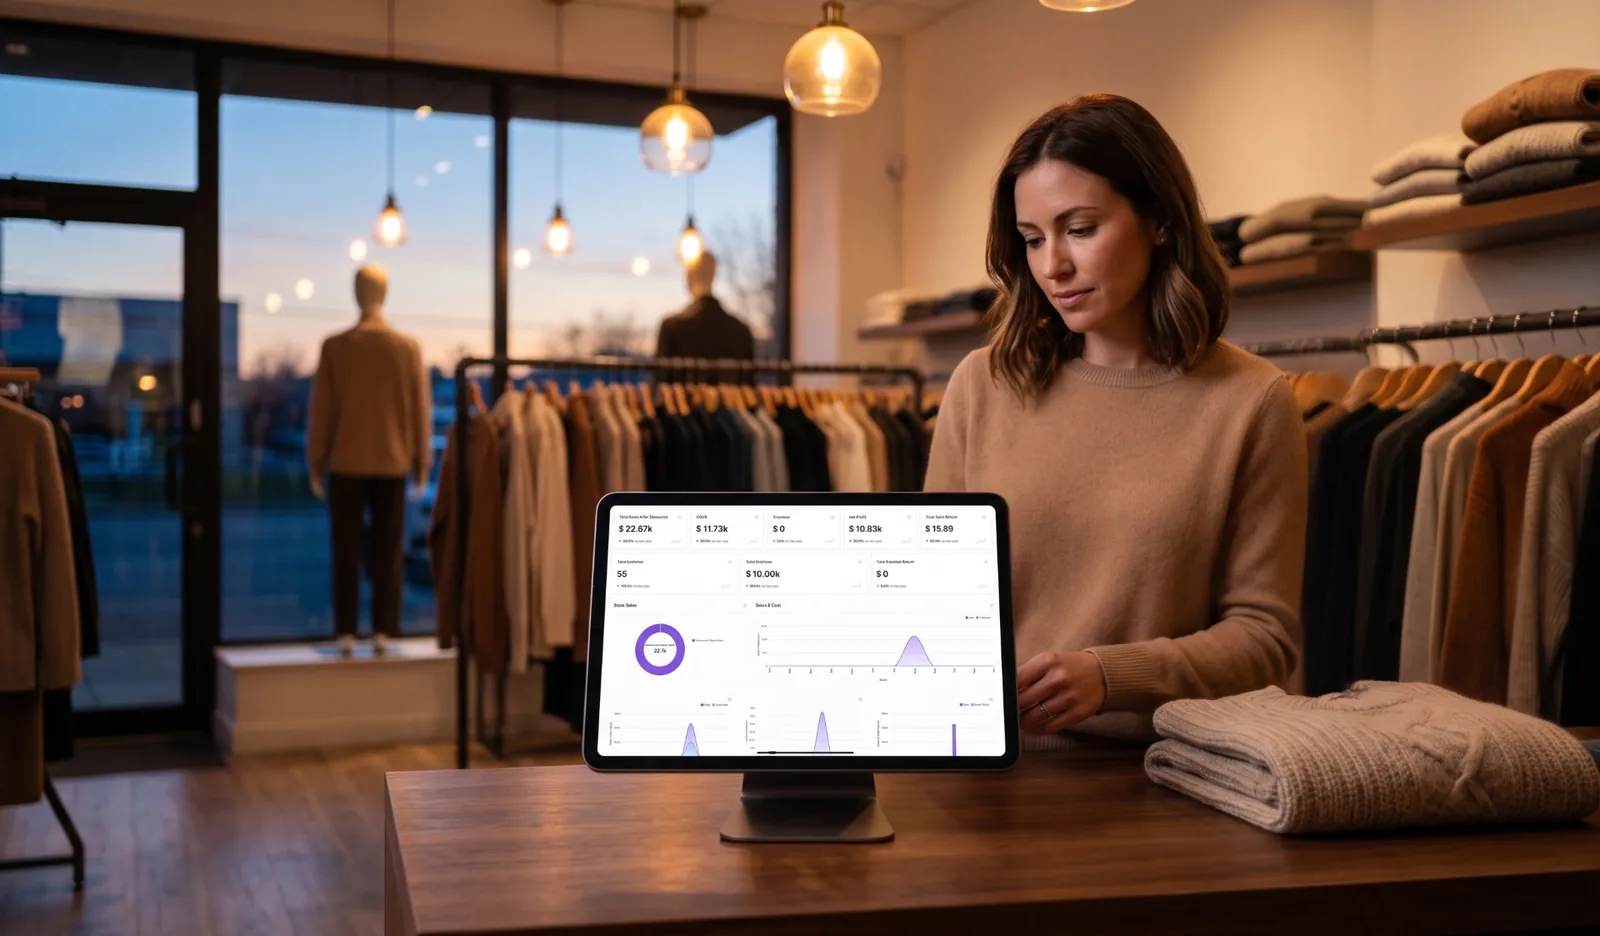
Live dashboards and deep-dive reports give you complete visibility into sales, customers, and team performance.
How it works
From raw data to actionable insights in three steps.
Collect Data
Every sale, customer interaction, and operation feeds into your analytics automatically.
- POS transaction data
- Customer behavior logs
- Inventory movements
- Staff activity tracking
Visualize Insights
Dashboards and charts surface trends, opportunities, and problems in real time.
- Live sales dashboards
- Product mix analysis
- Customer segmentation
- Trend identification
Make Decisions
Export reports, set alerts, and use data to drive smarter business decisions.
- Scheduled email reports
- CSV & PDF export
- Custom date ranges
- Alert thresholds
Analytics features
Every reporting tool you need to understand and grow your business.
Sales Dashboard
Real-time revenue, transactions, and average order value at a glance. Live updating metrics across all locations.
Sales Dashboard
$48.8k
Revenue
842
Orders
$58
AOV
Weekly Revenue
Product Mix
Identify top sellers, slow movers, and margin contributors by category. Understand what drives your revenue.
Product Mix
Revenue Reports
Daily, weekly, and monthly revenue breakdown with year-over-year comparisons and growth tracking.
Revenue Breakdown
Customer Insights
New vs. returning customers, lifetime value, and acquisition trends. Build a complete customer picture.
Customer Insights
68%
Returning
32%
New
Peak Hours
Identify your busiest periods to optimize staffing, inventory, and promotions for maximum impact.
Peak Hours
Staff Performance
Sales per employee, average ticket, and commission tracking. Reward top performers and coach improvement.
Staff Leaderboard
One platform.
Perfectly integrated.
Reports pull data from every module automatically, no manual exports.
6+
Integrated Modules
1
Unified Database
0
Manual Syncing
Beyond dashboards.
Live P&L
Expenses, cost of goods, and revenue roll into a real-time profit view. Log an expense and watch net profit update instantly: no month-end reconciliation.
Switching from Square, Shopify, Clover, Lightspeed, or SkyTab?
See the side-by-side: features, rates, and annual savings.
Frequently asked questions
A sales dashboard, revenue reports, product mix, customer insights, peak hours, and staff performance, all built from your live transaction data with nothing to configure.
Yes. Live P&L pulls from your sales, cost of goods, and tracked expenses, so you can see profitability as the month happens rather than finding out six weeks later from your bookkeeper.
Yes. Peak hours reporting shows your traffic and revenue by hour and day, which is what you want in front of you when you are building next week's schedule.
Yes. Cross-store reporting rolls every location up into one view while still letting you drill into any single store.
Yes. Staff performance reporting ties sales, average ticket, and transaction counts back to the person who rang them, since every team member works under their own account.
Ready to get started?
Join thousands of businesses already using Simple to power their operations.
Start your free trial
2.19% flat · No contracts · 14-day trial